Mutual Fund Overlap Calculator India (2025)
Are your mutual funds secretly the same? Compare up to five Indian equity funds to instantly see your true portfolio overlap and top common holdings.
Example: If Fund A holds 5% in ICICI Bank and Fund B holds 6%, the overlap contribution from that stock is 5% (the minimum of the two). We sum this for all common shares to get the total weighted overlap.
Here is a pre-rendered example showing a typical comparison. The funds have a weighted overlap of <strong>27.02%</strong>.
Weighted Overlap
| Stock | Min. Weight |
|---|---|
| ICICI Bank | 5.21% |
| Infosys | 4.67% |
| Axis Bank | 2.34% |
| Bharti Airtel | 3.12% |
| State Bank of India | 2.98% |
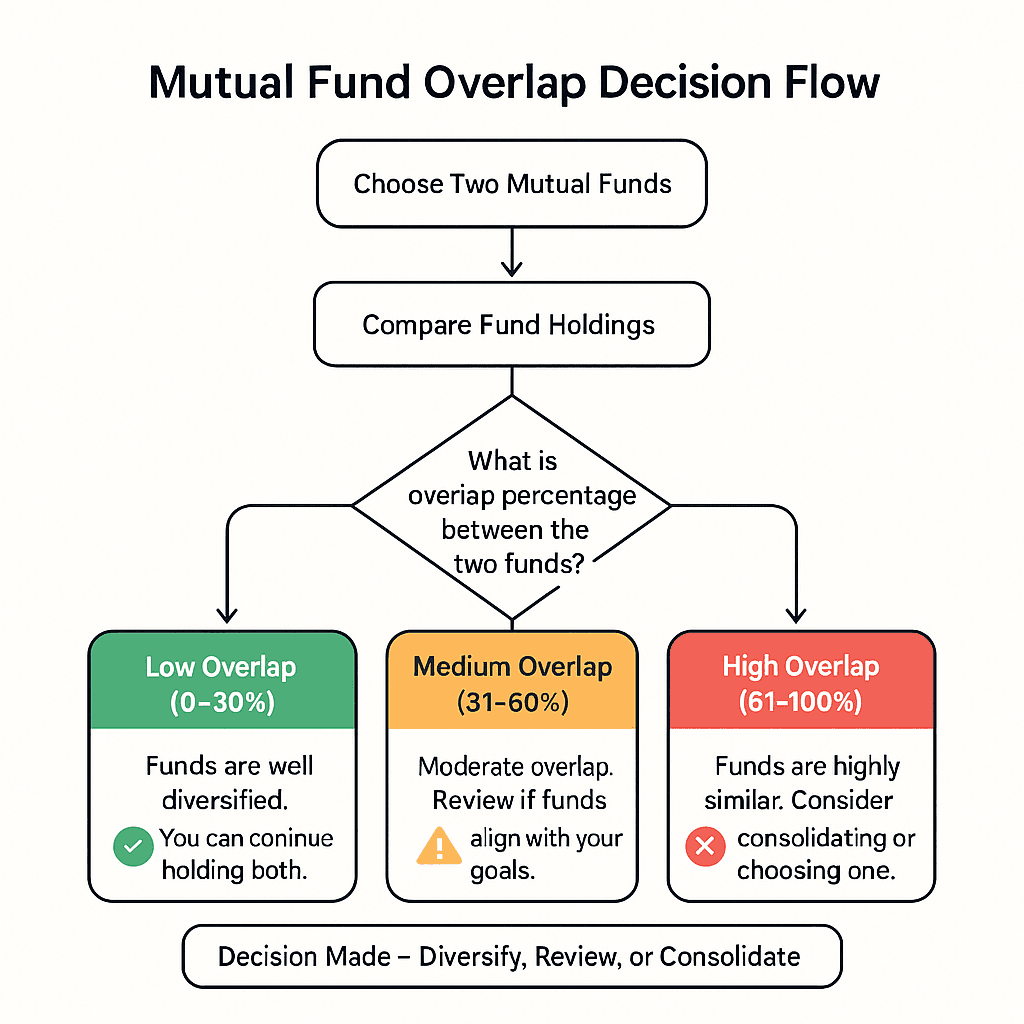
- Low (0-15%): Good diversification. The funds have distinct strategies.
- Moderate (15-30%): Common for funds in the same category (e.g., large-cap). Review to ensure you are comfortable with the shared exposure.
- High (30-50%): Significant overlap. You may be paying two sets of fees for the same stocks. Consider consolidating.
- Very High (>50%): The funds are practically clones. Replacing one to improve diversification is highly recommended.
Frequently Asked Questions
Data & Methodology
Data Sources: Our holdings data is sourced from publicly available scheme documents and updated periodically. While we strive for accuracy, we cannot guarantee it. Always verify with official AMC factsheets. Last Updated: Aug 2025.
Matching Logic: Holdings are matched first by their stock ticker (e.g., 'RELIANCE'). If a ticker is not available, we use a normalized company name (e.g., 'reliance industries' after removing 'Ltd', 'Inc', etc.). Non-equity holdings like 'Cash', 'Tri-party repo', or 'Net Receivables' are excluded from the calculation based on a regex match for common terms.
Worked Example (Weighted Overlap):
Weighted Overlap = Σ min(weight in Fund A, weight in Fund B) for all common stocks.
| Stock | Fund A (w%) | Fund B (w%) | Min Weight |
|---|---|---|---|
| ICICI Bank | 5.21 | 6.03 | 5.21 |
| Infosys | 4.67 | 5.06 | 4.67 |
| Axis Bank | 2.34 | 3.45 | 2.34 |
| Bharti Airtel | 3.12 | 4.50 | 3.12 |
| State Bank of India | 2.98 | 3.80 | 2.98 |
| ...and so on for all 35 common stocks... | |||
| Total Weighted Overlap | 27.02% | ||
Still not sure which funds to pick? That's completely normal. For a more personalized approach, I can help you get a curated list of funds based on your specific goals and risk profile.
Get My Personalized Fund List